A collaborative research group involving Tsinghua and Caltech has recently made a progress in machine-learning air pollution prediction model by capitalizing on large variations of urban air quality during the COVID-19 pandemic and real-time observations of traffic, meteorology, and air pollution in Los Angeles. This novel model can adequately account for the nonlinear relationships between emissions, atmospheric chemistry, and meteorological factors. Moreover, by considering future climate changes and traffic emissions, the model was used to assess the possible benefits of future traffic evolution, including vehicular electrification, in 2035 and 2050.
Los Angeles (LA) has long been one of the most polluted cities in the U.S. Photochemical smog happened in LA in 1940s and 1950s started the process of global pollution control of vehicle emission, making LA the city with the strictest vehicle emission control regulations.
During the COVID-19 pandemic, traffic was abruptly reduced in late March and early April, and then gradually recovered to the pre-COVID-19 level in LA. The COVID-19 induced variability of air quality provides an opportunity to evaluate the efficacy of traffic mitigation strategies.
Atmospheric chemical transport models have been widely used to examine the response of air pollutant concentrations to the changes of emissions and meteorological conditions. However, the challenge in preparing high-temporal-resolution emission profiles in the timely manner has limited a dynamic analysis of air quality impacts resulting from the abrupt emission changes through the pandemic period. Compared with traditional chemical transport modeling, the ML technique has more flexibility in leveraging real-world data and possesses higher computational efficiency. Here, machine-learned models are developed here to predict the hourly concentrations of three major pollutants: NO2, O3, and PM2.5in the LA basin, using one year and a half of observations of traffic information, meteorological conditions, and other socio-economic factors as inputs. The models exhibit high fidelity in reproducing the observed NO2, O3 and PM2.5concentrations, with coefficients of determination (R2) of 0.88, 0.86 and 0.65, respectively (Fig 1).
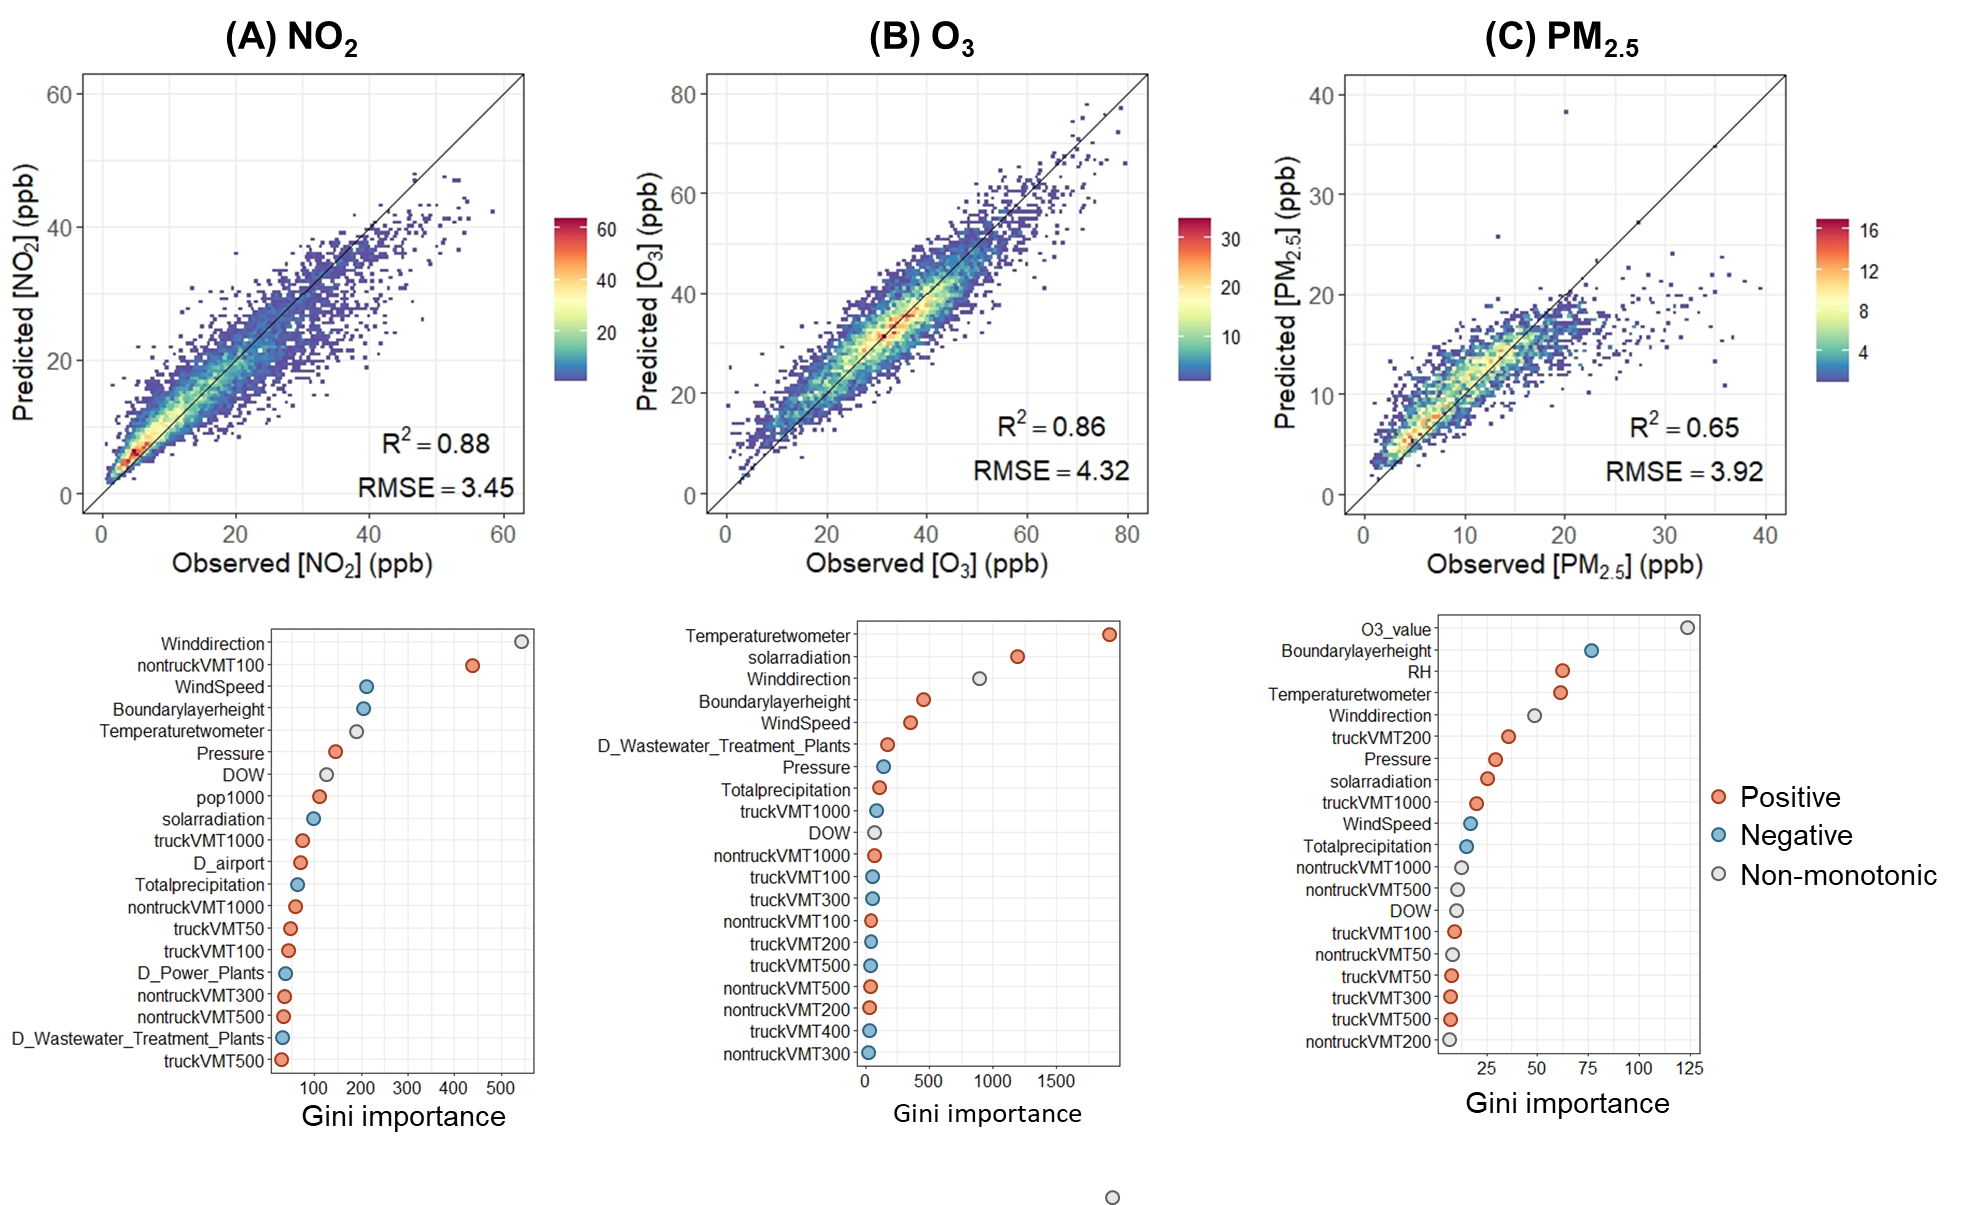
Figure 1. Model performance and variable importance for three species. (A) NO2, (B) O3, and (C) PM2.5 in Los Angeles. Cross-validated model R2 and root mean squared error (RMSE) are calculated by using a 5-fold cross-validation modeling performance for 24-h average concentrations. The color indicates the sample size for each dot. The variables are listed in order of importance from top to bottom. The horizontal axis represents the Gini index from the Random Forest model. A larger value represents higher importance.
The study conducted the ML model predictions with COVID-19 meteorology and pre-COVID-19 traffic information to reflect the influence of the COVID-19 induced traffic emission reductions (Fig 2). During the strictest lockdown period (6 April - 12 April), traffic reduction led to decreases in the daily averaged NO2 and PM2.5 concentrations by 27.8% and 17.5%, and an increase of daily 8-h average (MDA8) O3 by 6%. In which, truck emission reductions account for 61.1%, 81.6%, and 70.4% of all-traffic induced changes in NO2, MDA8 O3, and PM2.5, respectively.
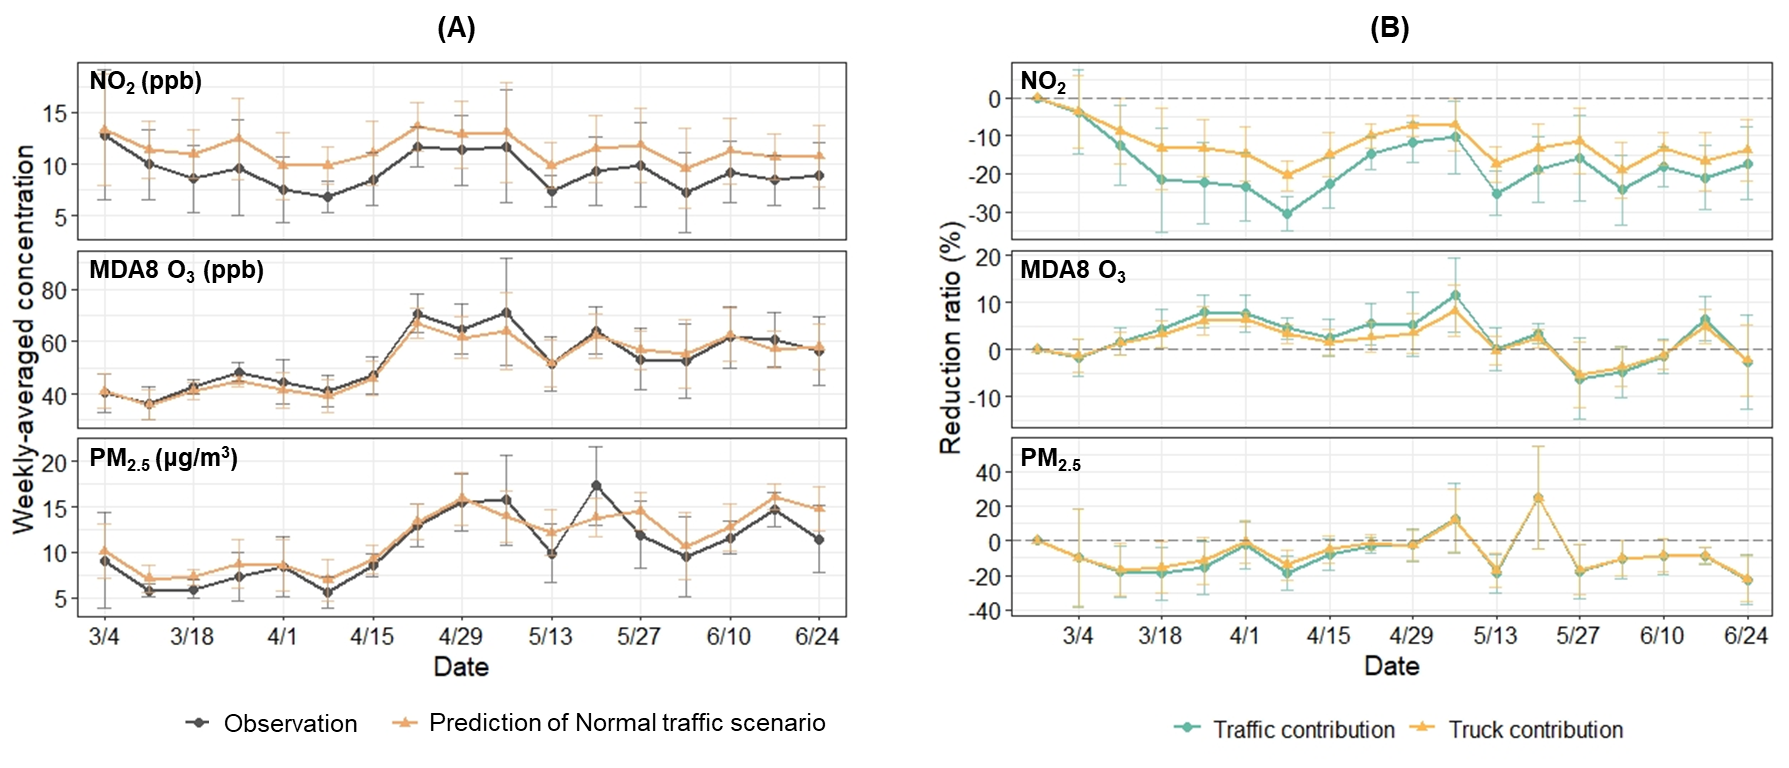
Figure 2. Comparison of observations and predictions. (A) Comparison of observations and predictions of normal traffic scenario and (B) the impact of traffic reduction from total fleet and truck fleet on NO2, O3, and PM2.5 concentrations during the lockdown period of the COVID-19 pandemic in Los Angeles. Each data point represents a weekly mean. The error bars are standard deviations from daily results in each week.
To build a direct linkage between pollutant concentrations and traffic activity, an emulator for each species based on the ML model results was developed. The emulator can predict the relative changes of emissions as a function of the fractional changes in truck and non-truck VMT relative to the year 2019 level. NO2 monotonically decreases along with the reduction in either truck or non-truck VMT (Fig 3A). The reduction slope is steeper for trucks, indicating the larger emission factor of NOx for diesel engines. MDA8 O3 generally increases with the reduction of truck traffic in a monotonic manner (Fig 3B), while an overall decrease in MDA8 O3 is found for the reduction of non-trucks. The distinctive impacts on ozone are likely explained by the fact that diesel trucks emit higher levels of NOx than non-trucks, but they share the similar non-methane VOC emission factor. Therefore, truck and non-truck emissions fall in NOx-saturated and NOx-limited regimes, respectively. This is also consistent with larger NO2 susceptibility to reductions of truck than non-truck emissions. The PM2.5 linkage with traffic is more complicated, especially with regard to non-truck emissions. In contrast with the monotonic decrease of PM2.5 in response to the reduction in truck VMT, the bended-curve (Fig 3C) response of PM2.5 is found along with the non-truck VMT reduction. Similar to MDA8 O3, the overall magnitude of fluctuation of PM2.5 is also smaller for non-truck (less than 0.1 𝜇g/m3) than that for truck. In general, regulation of trucks can be a more efficient way to lower PM2.5 concentrations than other vehicles.
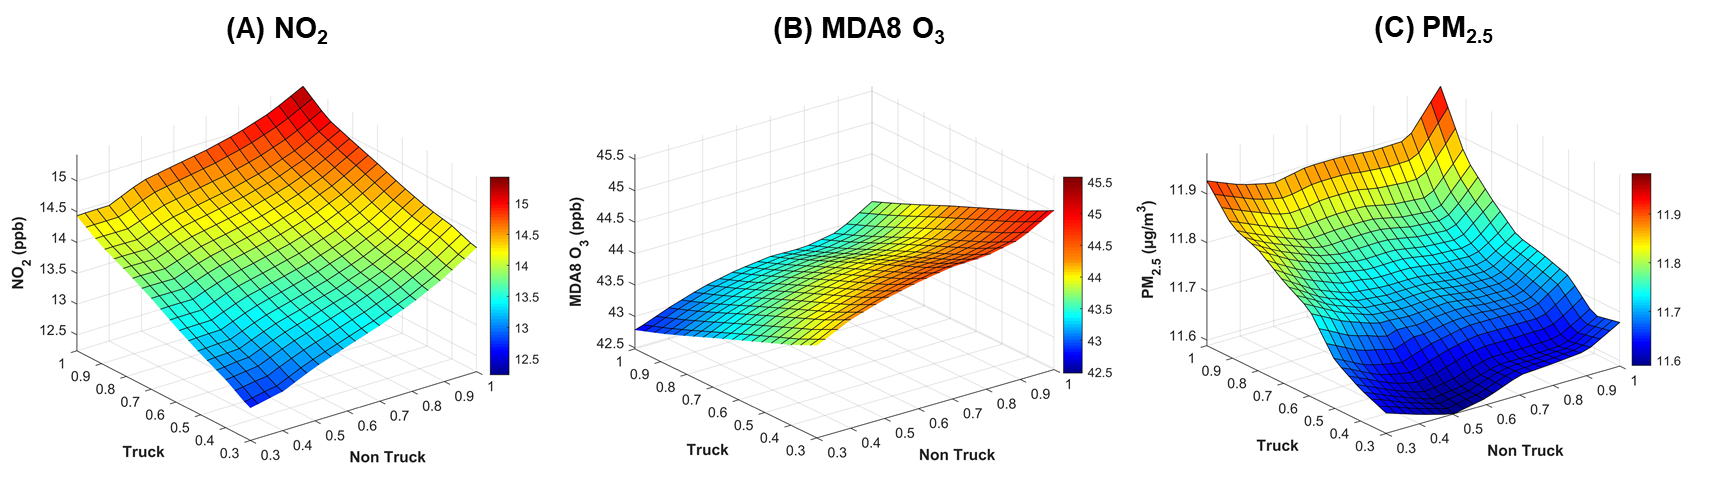
Figure 3. Predicted annual-average concentrations. Distribution of (A) NO2, (B) MDA8 O3, and (C) PM2.5 with different combinations of non-truck and truck activity fractional changes relative to the annual average level of 2019.
To further assess the impacts of fleet electrification on air quality, we independently alter the electrification rates of total fleet mileage based on scenario of 2035 and 2050. As shown in Fig 4, large-scale fleet electrification will achieve further alleviation of NO2 levels and is likely to transition Los Angeles to a less NOx-saturated regime of O3 formation. However, the benefit from fleet electrification on PM2.5 may be not attained if focused only on mitigation of on-road emissions. Moreover, emission standards of out-of-state vehicles should be aligned with those of the local fleet under federal efforts, and off-road emissions and those of volatile chemical products need to be more strictly regulated.
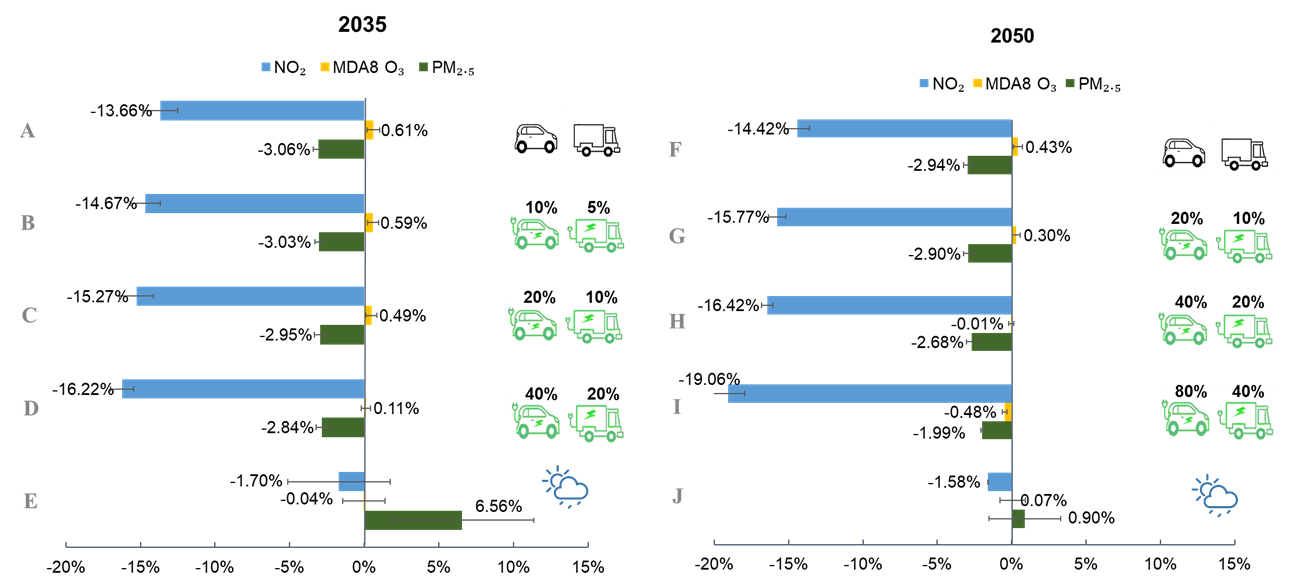
Figure 4. Reduction ratios of NO2, MDA8 O3, and PM2.5 concentrations under different traffic scenarios in 2035 and 2050 relative to 2019. (A-E) and (F-J) represents baseline traffic emission scenario from EMFAC, three electrification scenarios and future climate change scenario in 2035 and 2050, respectively. The error bars represent uncertainty of model predictions calculated by the Monte Carlo method. Random sampling was repeated for 100 times considering uncertainty of each variable in prediction of each scenario.
Dr. Shaojun Zhang from School of Environment, Tsinghua University, Dr. Yuan Wang and Prof. John H. Seinfeld, from Division of Geological and Planetary Sciences, Caltech, are the corresponding authors of the paper. Jiani Yang from Caltech and Yifan Wen from Tsinghua university are the first authors of the paper. This study was published online on June 22, 2021, in Proceedings of the National Academy of Sciences.
Link to the paper: https://www.pnas.org/content/118/26/e2102705118
Writer: Yifan Wen


 2017 School of Environment, Tsinghua University. All Rights Reserved. Address:School of Environment Tsinghua University, Beijing 100084, China